- Table of Contents
- Compare different Continents Statistics
-
Introduction to comparative continental statistics
-
Compare Colonial Status
-
Colonial Status Part 1
-
Colonial Status Part 2
-
Colonial Status Part 3
-
Compare Size of Collections
-
Classes comparison
-
Classes & Continents
-
Classes & Decades Part 1
-
Classes & Decades Part 2
-
Continents, classes, decades Part 1
-
Continents, classes, decades Part 2
-
Continents, classes, decades Part 3
-
Continents, classes, decades Comparison Part 1
-
Continents, classes, decades Comparison Part 2
-
Decades, continents, geographical spread
-
Archaeological & Ethnographic comparison per continent
-
Continent / Decade Snapshots
-
Archaeological & Ethnographic artefacts by continent and British colonial affiliation
-
Archaeological & Ethnographic comparison per continent
-
Continent / Tools and weapons comparison
Comparison of Geographical statistics regarding the Pitt Rivers Museum's collections up to 1945 - Tools , weapons and stone tools
[article ID:231]
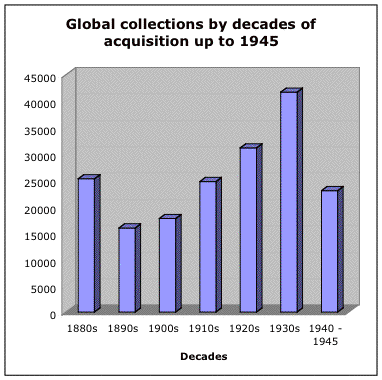
It became very clear, after some time spent compiling the geographical statistics, that there were some extremely important and dominating categories of objects, namely tools and weapons and specifically stone tools. This section looks at these categories in further details so that this dominance can be assessed.
The reason why tools and weapons, and particularly stone tools, are such a large component of the overall PRM collections up to 1945 (and indeed, up to the present day) is speculative. What is certain is that there has not been a great deal systematic research into or work with these objects in the Museum since they have been collected. Recent research by Sarah Milliken (of the Institute of Archaeology, Oxford) and Laura Phillips (of the Pitt Rivers Museum) suggests that many of the objects have been published, often prior to being accesssioned to the collections. There have been some ad hoc research carried out, particularly the work carried out over the last year or so on the African stone tool collections which suggests that, if anything, the numbers of stone tools that appear in our accession registers and therefore in our database, are underestimated.
A good many of these archaeological objects are very poorly provenanced or described although some collections are better than others in these respects. This might affect their usefulness for research purposes in the future.
For whatever reason, however, the Museum has accessioned large numbers of stone tools (and other tools and weapons) during its history and here is some more information about them.
Some caveats about stone tools and statistics
[article ID:232]
Stone tools are amongst the worst catalogued types of objects in the collections, there are a good number of collections which just give a vague provenanced (or maybe even a more detailed one) and then say something to the effect of 'A number of stone tools / flakes / flakes or cores' etc. For all these uncertainly numbered objects guesstimates have had to be added to the database and it is these that are used to get the figures used below (together with other properly accessioned stone tools). This means that any figures connected with stone tools are at best an estimate and at worse a complete guess that might be wholly inaccurate. This should be borne in mind when drawing any conclusions from the following figures.
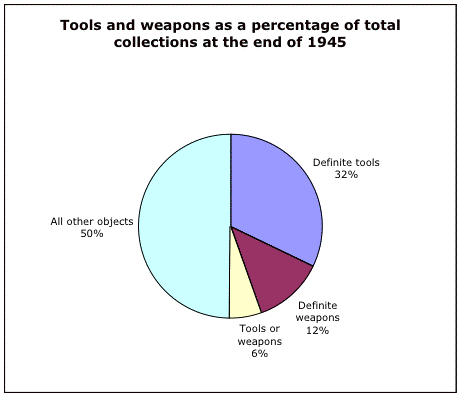
The tools and weapons have been examined in three overall categories, tools, weapons and tools or weapons. Whilst many of the latter category may be unspecifically categorised because the accession information is lacking, others of them are axes which, of course, could be used either as a tool or as a weapon and have therefore been entered as both and might more accurately be referred to as tools AND weapons. 4,788 axes were collected up to the end of 1945 (there is a total of 10,709 tools or weapons over the same period).
706 entries on objects prm were described as flaked tools but without the material glass or stone mentioned, some of these obviously will post-date 1945 but some must mean that some of the totals in the statistics for stone tools from specific countries are underestimates. Many percentages that are given are rounded up or down to the nearest full percentage mark.
This paper is a variation of part of a longer publication, co-authored by Sarah Milliken, Laura Philips, Alison Petch and Chris Gosden on the Museum's stone tool collections.
Large proportion of collections which are tools and weapons :
[article ID:233]
The easiest way to demonstrate the importance of tools and weapons to the collections as a whole is to review the total number of objects for each class, and the top 10s that can be extrapolated from those figures, for both 1945 and 2003:
| Up to 1945 |
|
|
Up to 2003 |
|
May 2003 |
October 2003 |
| Position |
Type |
No. of objects |
Position |
Type |
No. of objects |
No. of objects |
| 1 |
Tool |
68,459 |
1 |
Tool |
97,442 |
calculated differently |
| 2 |
Weapon |
32,794 |
2 |
Ornament & Bead |
41,353 |
41,348** |
| 3 |
Ornament & Bead |
21,345 |
3 |
Weapon |
41,056 |
calculated differently |
| 4 |
Religion |
15,125 |
4 |
Religion |
24,477 |
24,731 |
| 5 |
Pottery |
12,597 |
5 |
Pottery |
19,698 |
19,776 |
| 6 |
Figure |
9,571 |
6 |
Figure |
16,321 |
16,362 |
| 7 |
Vessel |
7,463 |
7 |
Clothing |
12,543 |
12,553 |
| 8 |
Clothing |
6,846 |
8 |
Vessel |
11,941 |
12,013 |
| 9 |
Specimen |
6,722 |
9 |
Specimen |
10,620 |
10,551** |
| 10 |
Music |
6,038 |
10 |
Trade |
10,400 |
10,398** |
The above table was constructed for the so-called 'Global Statistics' by searching for these terms without taking account of the other terms that might have been used to describe each object, this approach was taken when preparing statistics about classes in each continent. There are so many tools which might be weapons (and vice versa) that another way of expressing the same information, taking this into account, would be:
| |
Up to 1945 |
Up to 2003* |
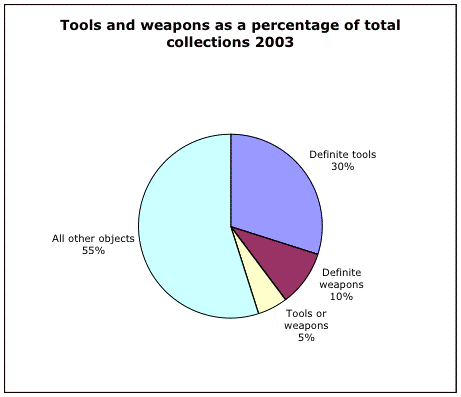
| Definite tools |
57,750 |
82,734 |
| Definite weapons |
22,085 |
26,424 |
| Tools or weapons |
10,709 |
14,721 |
| Definite stone tools |
48,968 |
71,394 |
| |
|
|
| Total of all tools and weapons [excl stone tools] |
90,544 |
123,879 |
| Total number of other objects |
89,221 *** |
150,745 |
| Total number of objects |
179,765 |
274,624 |
[It should be obvious that definite tools include the figure for definite stone tools].
* - as at 8.10.03, this does not correspond with other 2003 figures given above (which were based on the database as at May 2003, so we recalculated all the top 10 classes using the on-line database, hoping that no new classes have emerged as most common, see last column of first table above.
** - in case people are concerned with this apparent drop in total number of 2 of the classes, we would think this is due to the fact that between May and October 2003 the DCF Court Project has been working and has probably been able to turn some guesstimate of number of objects into some more accurate, lower, figure.
*** - total of all tools and weapons worked out by adding definite tools, definite weapons and tools and weapons, total number of other objects found by taking away total of tools and weapons from total number of all objects
Using these more refined numbers gives the following most common types of objects table:
| Up to 1945 |
|
|
Up to October
2003 * |
|
|
| Position |
Type |
No. of objects |
Position |
Type |
No. of objects |
| 1 |
Definite tools |
57,750 |
1 |
Definite tools |
82,734 |
| 2 |
Definite stone tools |
48,968 |
2 |
Definite stone tools |
71,394 |
| 3 |
Definite weapons |
22,085 |
3 |
Ornament & Bead |
41,348 |
| 4 |
Ornament & Bead |
21,345 |
4 |
Definite weapons |
26,424 |
| 5 |
Religion |
15,125 |
5 |
Religion |
24,731 |
| 6 |
Pottery |
12,597 |
6 |
Pottery |
19,776 |
| 7 |
Tools or weapons |
10,709 |
7 |
Figure |
16,362 |
| 8 |
Figure |
9,571 |
8 |
Tools or weapons |
14,721 |
| 9 |
Vessel |
7,463 |
9 |
Clothing |
12,553 |
| 10 |
Clothing |
6,846 |
10 |
Vessel |
12,013 |
In 1945 ornaments and beads (a composite class combining two classes 'ornament' and 'bead' for which there is a great deal of overlap, worked out by searching for ornament and bead, ornament minus bead and vice versa and combining the totals (as has been done for every continent) were very close in figure to the number of weapons, and by 2003 they had overtaken weapons as the 3rd most common type of object. Otherwise stone tools can be seen to be the second most common type of object, and in this case a very specific type of object, effectively dominating the numbers game of objects, No other objects come close to being so numerous.
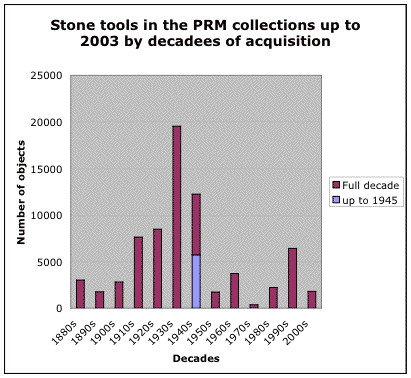
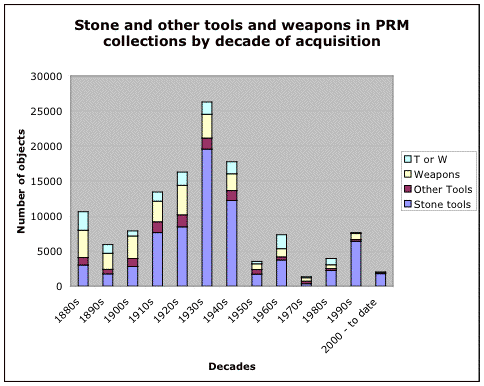
When were stone tools acquired?
[article ID:235]
1880s - 3,004
1890s - 1,756
1900s - 2,806
1910s - 7,633
1920s - 8,470
1930s - 19,541
1940 - 1945 - 5,710
1940s [all] - 12,232
1950s - 1,716
1960s - 3,722
1970s - 355
1980s - 2,224
1990s - 6,412
2000s - 1,794
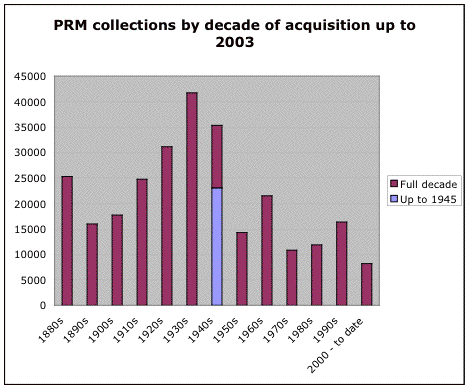
The pattern of acquisition of stone tools certainly seems to mirror the global pattern for all objects with a decline in the 1890s - 1900s and a gradual increase again until the 1930s then a decline again from the 1940s. The pattern after 1945 also seems to match.
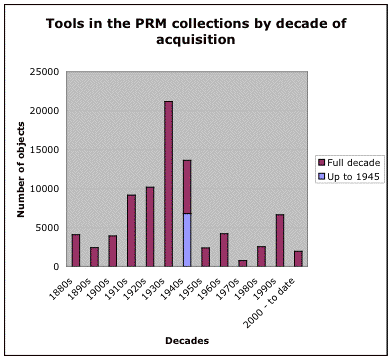
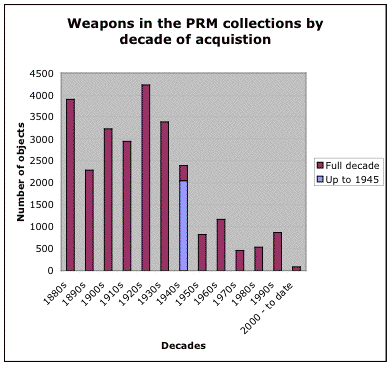
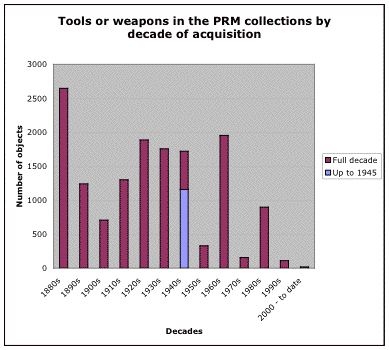
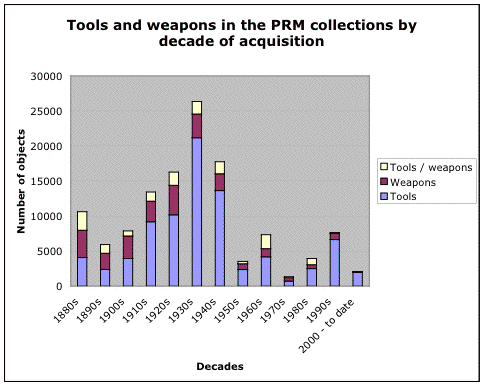
Acquisition of all tools and weapons
[article ID:236]
Definite tools:
1880s - 4,072
1890s - 2,408
1900s - 3,929
1910s - 9,164
1920s - 10,166
1930s - 21,177
1940 - 1945 - 6,783
1940s [all] - 13,629
1950s - 2,363
1960s - 4,189
1970s - 727
1980s - 2,517
1990s - 6,642
2000s - 1,942
Definite weapons:
1880s - 3,902
1890s - 2,286
1900s - 3,226
1910s - 2,946
1920s - 4,226
1930s - 3,387
1940 - 1945 - 2,046
1940s [all] - 2,390
1950s - 823
1960s - 1,168
1970s - 457
1980s - 533
1990s - 868
2000s - 90
Tools or weapons:
1880s - 2,647
1890s - 1,239
1900s - 705
1910s - 1,298
1920s - 1,887
1930s - 1,759
1940 - 1945 - 1,157
1940s [all] - 1,724
1950s - 327
1960s - 1,957
1970s - 156
1980s - 896
1990s - 110
2000s - 19
We think this final graph shows very graphically [!] how dominating the stone tools are of tools and weapons as a category and how this domination is present in every decade of the Museum's history.
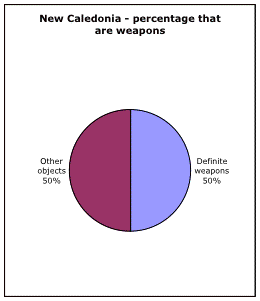
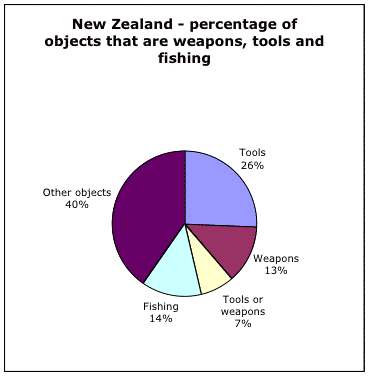
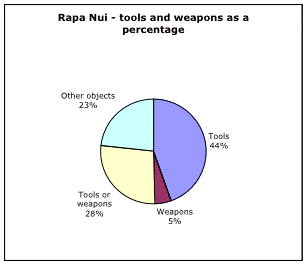
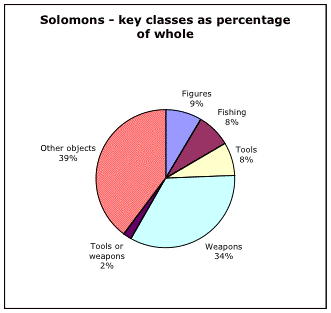
Continental patterns in tools and weapons collections
[article ID:237]
Each continents and countries' proportions are slightly different, here is relevant information from the various continental statistical reports (as discussed before, some of these graphs show the minimum number of stone tools and weapons):
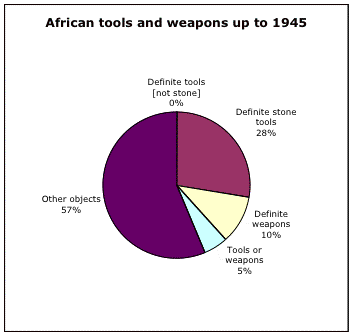
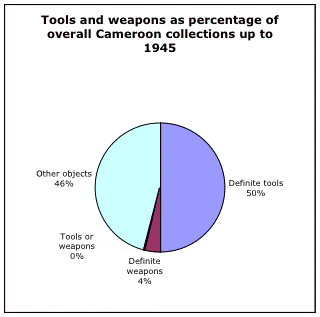
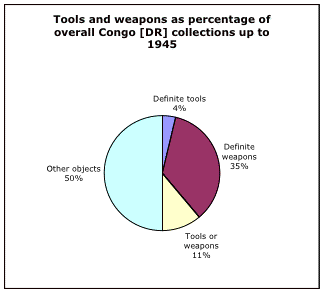
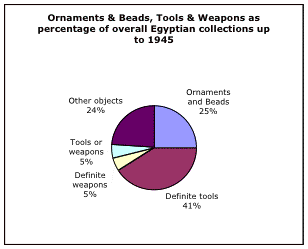
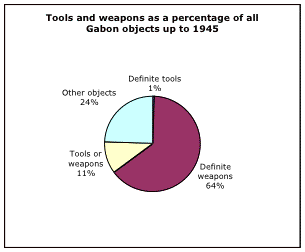
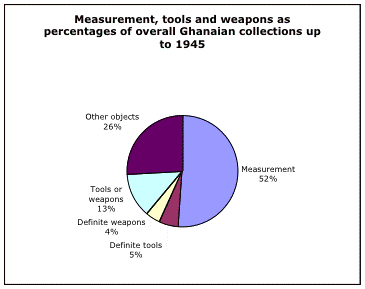
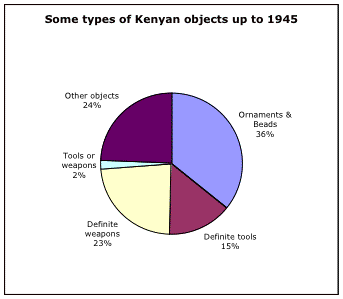
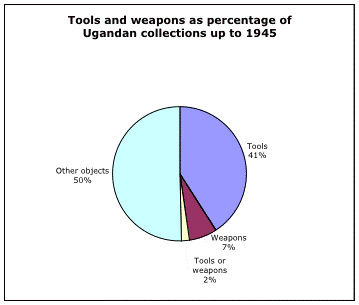
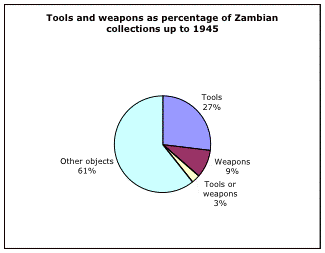
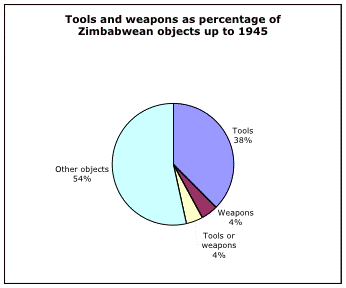
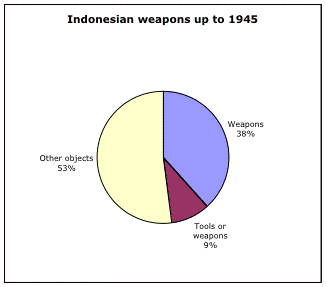
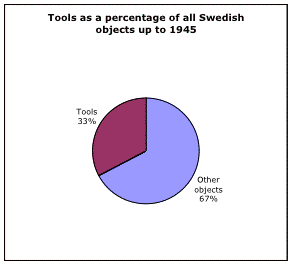
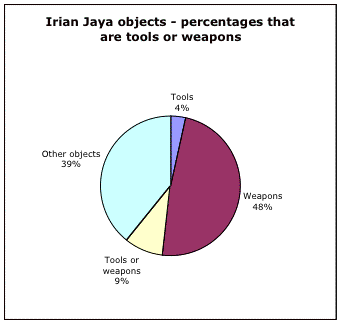
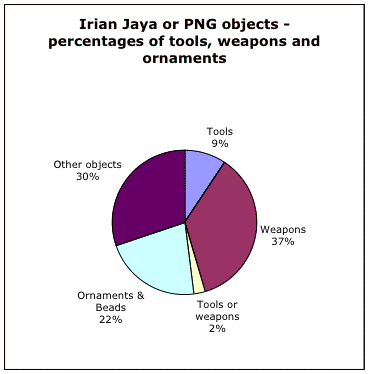
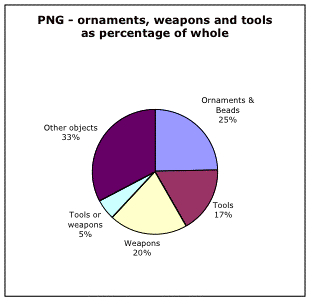
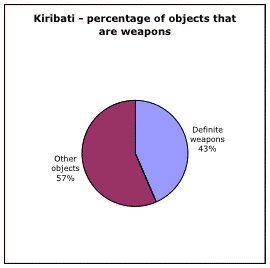
African tools and weapons:
The following African countries also have large tool and weapons collections (proportionally) [see African statistics part IV for more information]:
NB other African countries have large proportions of tools and weapons of their collections but their overall collection numbers are low and we have therefore not shown their summary graphs.
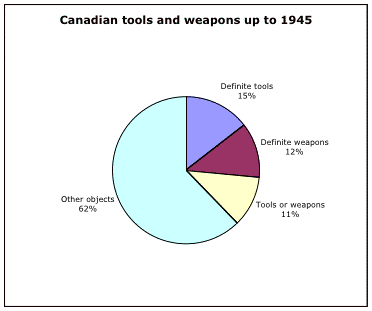
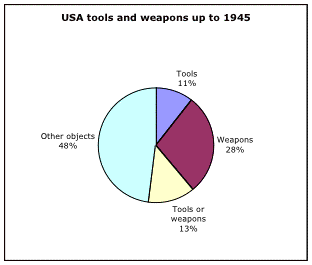
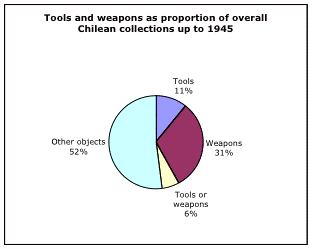
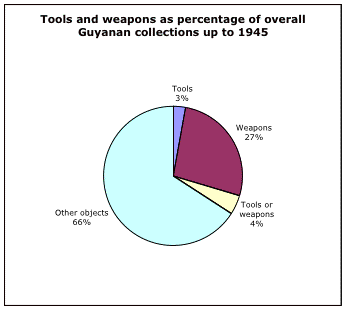
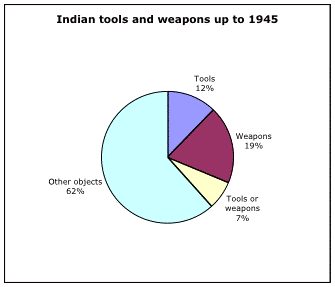
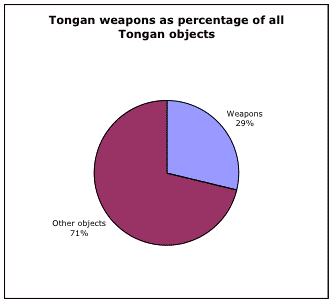
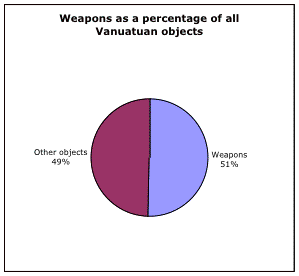
American tools and weapons:
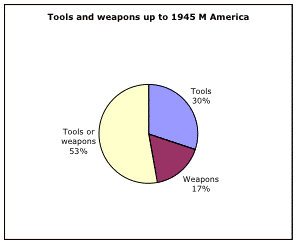
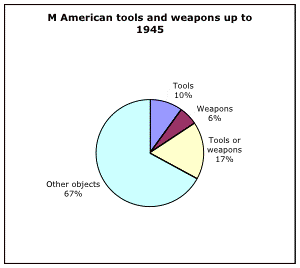
Middle America:
Most Middle American countries' collections are small but you should note that several countries' collections are dominated by tools and weapons even though the overall number of objects from each country is small.
North America:
South America:
Tools are much less common in the South American collections than they are globally [down from 1st to 8th position), other less common types of objects are weapons [from 2 to 3]. Of the 557 actual tools only 121 are made of stone, this is probably the lowest proportion of stone tools against all objects of any continent at below 2 per cent of total collection. This low proportion must explain why the number of tools overall is so low - for some reason most tools collected round the world are stone tools (and therefore in most instances, archaeological). For some reason these were not collected in any number in South America and therefore proportionally tools are not so important as they are in other areas (compare and contrast to Australia which had an overwhelming number of stone tools).
NB there is double counting between the 2 above pie charts because of the Patagonian entries (see S American stats report for further information)
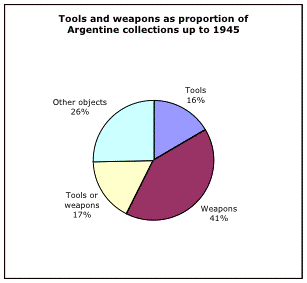
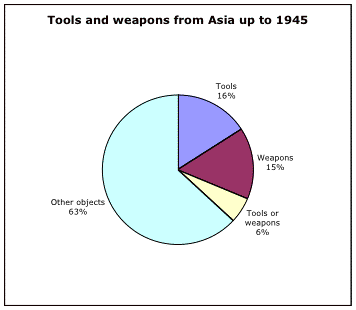
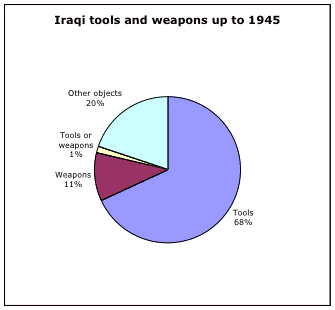
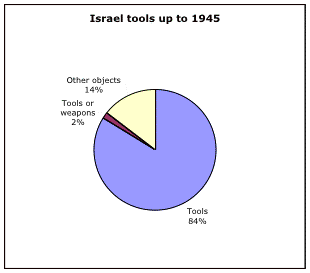
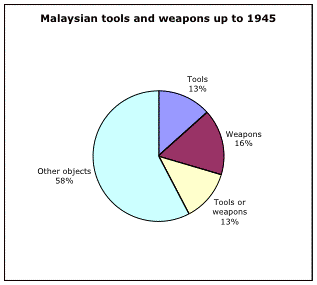
Asia tools and weapons:
There are far fewer tools as a percentage of total collection in the Asian collections than there are globally up to 1945 and slightly more weapons.
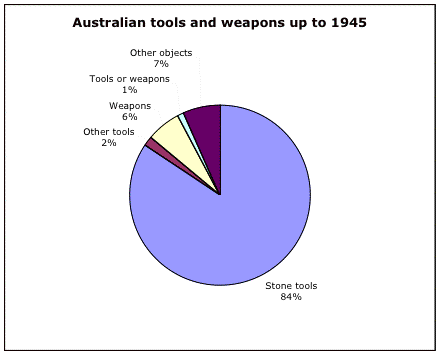
Australia tools and weapons
Of all continents and countries Australia is the most dominated by tools and specifically by stone tools:
| Types of objects |
Total number of objects |
% of total Australian collection |
| Definite Tool |
15,922 |
86.4% |
| Definite Weapon |
1,088 |
5.8% |
| Either tool or weapon |
225 |
1.2% |
| Other objects |
1,230 |
6.6% |
| |
|
|
| Stone tool [definite] |
15,610 |
84.5% |
| Percentage of tools that are stone tools |
98% |
|
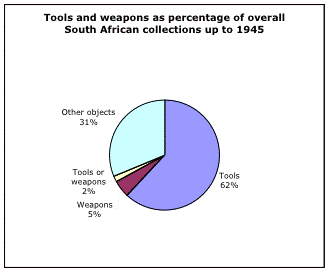
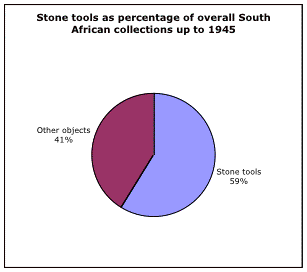
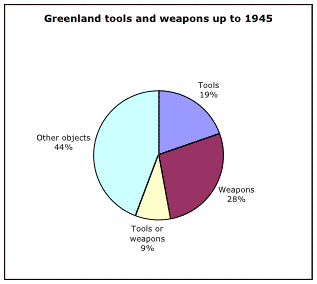
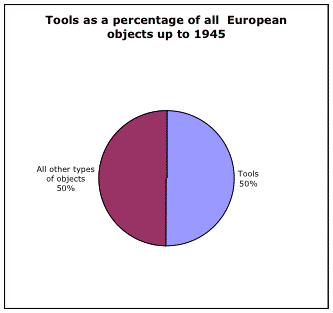
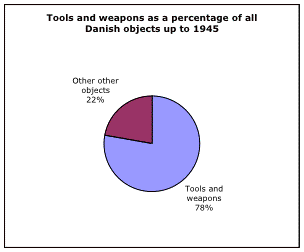
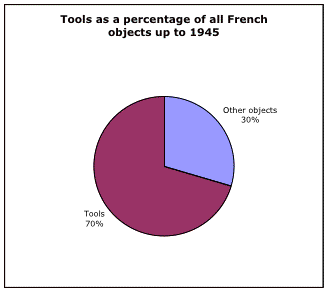
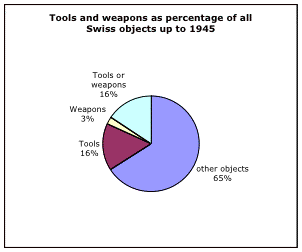
European tools and weapons:
Note that the Danish figure is a 'proper' figure calculated by adding together definite tools and weapons and tools or weapons.
2,817 of the 3,296 French tools are stone, 3,239 are archaeological, the Irish figure was worked out as per Denmark above, there is exactly the same picture for items which are not clearly identified as either southern Irish or Northern Ireland.
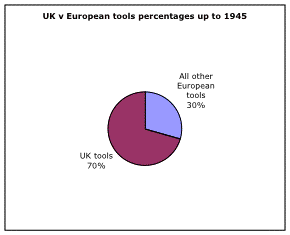
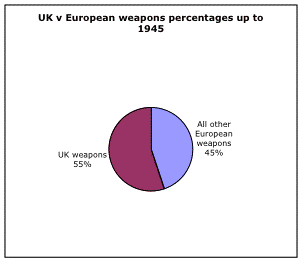
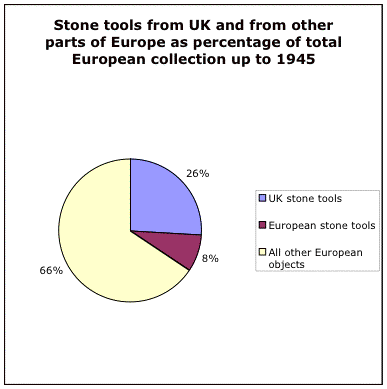
In general the UK is in fact by far the most dominant European collection. Its figures whether divided into classes or taken as a whole overshadow the other European countries collections, this is especially true of tools and weapons and of stone tools in particular.
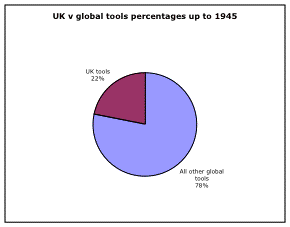
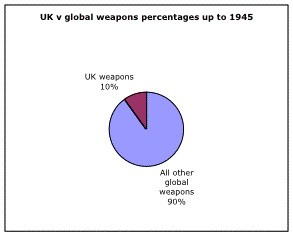
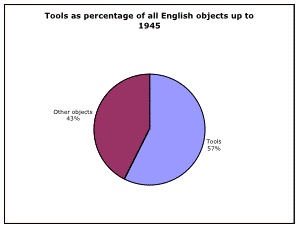
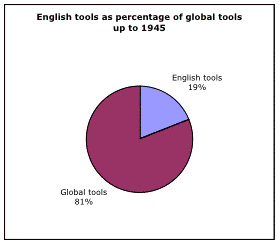
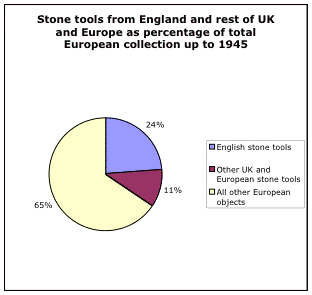
That is, one in every fourth European objects in the collections up to 1945 was a stone tool from the UK, and as can be seen from the next pie chart nearly one in four is in fact a stone tool from England so greatly does England dominate the UK figures for all classes. Truly the PRM has a wide ranging home collection.
As has been shown before the UK forms 61 per cent of the overall European collection, and England forms 54 per cent (see Part I). It is therefore not surprising that these figures so dominate other countries figures for particular classes of objects
Again many other European countries have dominating tools and weapons proportionally to their total number of objects but their overall totals are low so I have not replicated their graphs [see Europe stats Part III for more information]
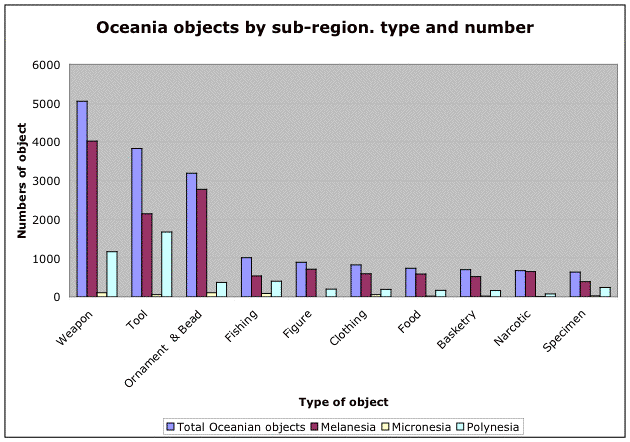
Oceanian weapons and tools:
Interestingly weapons were much more collected (and accessioned) from Oceania than tools - a big reversal of the global trends where stone tools represent a massive proportion of the total collections.
Field collectors of stone tools:
[article ID:238]
The following table gives information about the field collectors in the top 20 field collectors up to 1945. The ones marked in red had significant collections of stone tools, however it is interesting that with the exception of Canziani they all gave at least one stone tool:
| Name |
Is there a biography? |
Total number of objects collected * |
Total number of stone tools in field collection * |
% of coll. that are tools |
Stone weapons * |
Continent most commonly collected in |
Date by which most objects were field collected |
| Henry Balfour |
Yes |
11,914 |
3,636 |
31% |
471 |
Mixed |
By 1938 |
| Ernest Westlake |
Yes |
9,766 |
9,750 |
99% |
0 |
Australia |
By 1910 |
| Beatrice Blackwood |
Yes |
6,526 |
438 |
7% |
69 |
N America, Pacific UK etc |
1924 - 1939 |
| Anthony John Arkell |
Yes |
6,331 |
54 |
1% |
2 |
Sudan Zimbabwe Europe |
By 1944 |
| Francis Llewellyn Griffith etc |
Yes |
5,415 |
234 |
4% |
2 |
Sudan Egypt Uganda USA |
By 1934 |
| Louis Seymour Bazett Leakey |
Yes |
5,359 |
5,286 |
99% |
0 |
Kenya |
By 1930 |
| Mervyn David Waldegrave Jeffreys |
Yes |
5,017 |
1,337 |
27% |
100? |
Cameroon Nigeria |
By 1946 |
| Charles Gabriel Seligman |
Yes |
4,797 |
2,616 |
55% |
188 |
Africa and Mixed |
By 1940 |
| Augustus Henry Lane Fox Pitt Rivers |
Yes |
4,468 |
1,002 |
22% |
23 |
UK France |
By 1884 |
| Alexander Montgomerie Bell |
Yes |
3,667 |
3,281 |
89% |
9 |
UK Belgium etc |
By 1920 |
| John Henry Hutton |
Yes |
3,465 |
49 |
1% |
0 |
India UK |
By 1936 |
| James Philip Mills |
Yes |
3,043 |
7 |
0% |
1 |
Tibet India etc UK |
By 1948 [but majority earlier |
| John V. Cook |
Yes |
3,000 |
3,000 |
100% |
0 |
Australia |
c 1910 |
| Richard Carnac Temple |
Yes |
2,835 |
1 |
0% |
0 |
Burma India China Europe Nicobar |
By 1916 |
| Dorothy Anne Elizabeth Garrod |
Yes |
2,780 |
2,459 |
88% |
26 |
Israel Palestine Jordan N Africa etc |
1929 - 1934, by 1963 |
| Basil Hall Chamberlain |
Yes |
2,266 |
79 |
3% |
139 |
Japan |
By 1908 |
| James A. Swan |
Yes |
1,862 |
1,481 |
80% |
4 |
S Africa |
By 1954 but some earlier |
| Robert Powley Wild |
Yes |
1,736 |
56 |
3% |
4 |
Ghana other W Africa UK |
By 1935 |
| Estella Louisa Michaela Canziani / or her parents |
Yes |
1,449 |
0 |
0% |
[1] |
Italy, Europe, N Africa |
By 1940 |
| Ralph Tanner probably Ralph Esmond Selby Tanner |
Prob |
1,410 |
5,08 |
36% |
0 |
Tanzania |
By 1958 |
* Because of the problem of calculating collection dates and sizes the field collector information was worked out using the main on-line database and these figures are therefore the person's entire field collection, some of which MIGHT have been field collected after 1945 but probably was not. In addition, because objects prm has been amended in the meantime, some of the figures vary from the figures given in the field collectors statistics.
There are several collectors outside the top 20 of field collectors who are sizeable collectors of stone tools (taken as being over 500 stone tools) including:
| Name |
Is there a biography? |
Total number of objects collected * |
Total number of stone tools in field collection * |
% of coll. that are tools |
Stone weapons * |
Continent most commonly collected in |
Date by which most objects were field collected |
| Francis Howe Seymour Knowles |
Yes |
1,025 |
754 |
74% |
26 |
UK |
By 1949 but most earlier |
| Penelope Ward |
No |
1,260 |
1,260 |
100% |
0 |
S Africa |
By 1935 |
| K.V. Todd |
No |
918 |
873 |
95% |
0 |
India |
By 1966 |
| William Scoresby Routledge / & Katherine Routledge |
Yes |
1,349 |
539 |
40% |
39 |
Easter Ids and Americas |
By 1916 |
| H.V.V. Noone |
Yes |
580 |
573 |
99% |
0 |
Mixed |
By 1948 |
Note that a few of the people in both tables might have collected post 1945 [Tanner, FHS Knowles, KV Todd and HVV Noone]
Table showing top 16 stone tool field collectors up to 1945:
| Name |
Total number of objects collected * |
Total number of stone tools in field collection * |
Stone weapons * |
Stone tools or weapons * |
Total number of all stone tools and weapons * [Total of last 3 columns] |
% of coll. that are stone tools & weapons |
Continent most commonly collected in |
Date by which most objects were field collected |
| Ernest Westlake |
9,766 |
9,750 |
0 |
0 |
9,750 |
99% [99%] |
Australia |
By 1910 |
| Louis Seymour Bazett Leakey |
5,359 |
5,286 |
0 |
73 |
5,359 |
100% [99%] |
Kenya |
By 1930 |
| Henry Balfour |
11,914 |
3,636 |
471 |
392 |
4,499 |
38% [31%] |
Mixed |
By 1938 |
| Alexander Montgomerie Bell |
3,667 |
3,281 |
9 |
77 |
3,367 |
92% [89%] |
UK Belgium etc |
By 1920 |
| John V. Cook |
3,000 |
3,000 |
0 |
0 |
3,000 |
100% |
Australia |
c 1910 |
| Charles Gabriel Seligman / Brenda Seligman |
4,797 |
2,616 |
188 |
457 |
3,261 |
68% [55%] |
Africa and Mixed |
By 1940 |
| Dorothy Anne Elizabeth Garrod |
2,780 |
2,459 |
26 |
294 |
2,779 |
100% [88%] |
Israel Palestine Jordan N Africa etc |
1929 - 1934, by 1963 |
| James A. Swan |
1,862 |
1,481 |
4 |
29 |
1,514 |
81% [80%] |
S Africa |
By 1954 but some earlier |
| Mervyn David Waldegrave Jeffreys |
5,017 |
1,337 |
100? |
137 |
1,574 |
31% [27%] |
Cameroon Nigeria |
By 1946 |
| Penelope Ward |
1,260 |
1,260 |
0 |
0 |
1,260 |
100% |
S Africa |
By 1935 |
| Augustus Henry Lane Fox Pitt Rivers |
4,468 |
1,002 |
23 |
260 |
1,285 |
29% [22%] |
UK France |
By 1884 |
| K.V. Todd |
918 |
873 |
0 |
45 |
918 |
100% [95%] |
India |
By 1966 |
| Francis Howe Seymour Knowles |
1,025 |
754 |
26 |
117 |
897 |
88% [74%] |
UK |
By 1949 but most earlier |
| H.V.V. Noone |
580 |
573 |
0 |
3 |
576 |
99% |
Mixed |
By 1948 |
| William Scoresby Routledge / & Katherine Routledge |
1,349 |
539 |
39 |
252 |
830 |
62% [40%] |
Easter Ids and Americas |
By 1916 |
| Ralph Tanner probably Ralph Esmond Selby Tanner |
1,410 |
508 |
0 |
0 |
508 |
36% |
Tanzania |
By 1958 |
Percentages in blue are the percentages of total number of objects collected by the field collector that are stone tools
Donors of stone tools:
[article ID:239]
The following are the top 20 INDIVIDUAL donors of objects to the museum up to 1945 (I have omitted institutions).
| Name |
Total number of objects donated * |
Total number of stone tools in donation * |
Total number of stone weapons in donation * |
Total number of stone tools or weapons in donation * |
Total number of all stone tools and weapons * [Total of last 3 columns] |
% of collection that are stone tools & weapons |
Continent most commonly collected in |
Last date by which most objects were donated |
| Augustus Henry Lane Fox Pitt Rivers |
17,927 |
2,681 |
104 |
1,567 |
4,352 |
24% |
Mixed |
1884 |
| Henry Balfour |
14,969 |
4,321 |
533 |
244 |
5,098 |
34% |
Mixed |
1938 |
| Estate of Ernest Westlake or Aubrey Westlake |
13,033 |
13,015 |
0 |
0 |
13,015 |
100% |
Australia |
1940 [at latest] |
| Beatrice Blackwood |
6,857 |
451 |
94 |
202 |
747 |
11% |
Mixed |
1975 [but most earlier] |
| Anthony John Arkell |
6,329 |
3 |
2 |
1 |
6 |
0% |
Africa Europe |
1971 [but most earlier] |
| Louis Seymour Bazett Leakey |
5,597 |
5,371 |
0 |
224 |
5,595 |
100% |
Africa |
1947 [but most earlier] |
| Francis Llewellyn Griffith |
5,451 |
202 |
2 |
8 |
212 |
4% |
Africa N America |
1934 |
| Charles Gabriel Seligman & Brenda Seligman |
5,035 |
2,761 |
203 |
487 |
3,451 |
69% |
Mixed |
1940 |
| Archibald Colquhoun Bell |
3,696 |
3,274 |
63 |
128 |
3,465 |
94% |
Mixed |
1920 |
| John Henry Hutton / per P. Bertram Hutton |
3,588 |
21 |
291 |
0 |
312 |
9% |
Asia Europe |
?1933 |
| Richard Carnac Temple |
3,170 |
4 |
1 |
1 |
6 |
0% |
Mixed |
?1920 |
| James Philip Mills |
3,057 |
7 |
1 |
144 |
152 |
5% |
Asia Europe |
1948 [but most earlier] |
| Anna Tylor [Edward Burnett Tylor] |
2,876 |
1,185 |
62 |
10 |
1,257 |
44% |
Mixed |
1917 |
| British School of Archaeology Jerusalem ** |
2,385 |
2,203 |
0 |
31 |
2,234 |
94% |
Asia |
1931 |
| Estella Louisa Michaela Canziani |
2,246 |
0 |
1 |
0 |
1 |
0% |
Mixed |
1965 [but most earlier] |
| James A. Swan |
1,898 |
1,596 |
4 |
30 |
1,630 |
86% |
Africa |
1954 [but most earlier] |
| Robert Powley Wild |
1,878 |
62 |
4 |
357 |
423 |
23% |
Mixed |
1932 |
| Basil Hall Chamberlain |
1,761 |
79 |
139 |
47 |
265 |
15% |
Asia |
1908 |
| Louis Colville Gray Clarke |
1,501 |
78 |
76 |
70 |
224 |
15% |
Mixed |
1921 |
| Edward Burnett Tylor |
1,421 |
534 |
26 |
1 |
561 |
39% |
Mixed |
1917 |
** We kept this one in table, though it is obviously not an individual, because in effect it acts as one (it does not appear in the top 20 [or less] field collectors however because many of its field collectors are named)
Note that generally for the PRM donors, there is a little bit of double counting or uncertainty with a small number of found unentered or poorly provenanced items which might have come from a number of different donors (eg some items are not clearly provenanced and have been accessioned as coming from either Balfour or the founding collection - this is particularly true for those items which were found unentered and accessioned before the comprehensive computer database was compiled, making it easier to search for 'hidden' objects.
This table definitely contains some items which were donated post 1945 (say, from Beatrice Blackwood for example) but in most instances the bulk of the donations were pre-1945.
Just in case you were wondering (we did) the remainder of the Westlake collection are specimens of ochre etc.
The following people also have collections over 500 strong of stone tools that they donated:
| Name |
Total number of objects donated * |
Total number of stone tools in donation * |
Total number of stone weapons in donation * |
Total number of stone tools or weapons in donation * |
Total number of all stone tools and weapons * [Total of last 3 columns] |
% of collection that are stone tools & weapons |
Continent most commonly collected in |
Last date by which most objects were donated |
| Penelope Ward |
1,260 |
1,260 |
0 |
0 |
1,260 |
100% |
Africa |
1935 |
| H.V.V. Noone |
576 |
573 |
0 |
3 |
576 |
100% |
Mixed |
1948 |
| William Scoresby Routledge / & Katherine Routledge |
1,349 |
596 |
73 |
252 |
921 |
68% |
Oceania Polynesia and Americas |
1916 |
| Ralph Tanner probably Ralph Esmond Selby Tanner |
1,410 |
508 |
0 |
0 |
508 |
36% |
Africa |
1958 |
| Charles Hartley |
659 |
647 |
0 |
0 |
647 |
98% |
Asia |
1920 |
| Edward Bagnall Poulton |
570 |
525 |
10 |
3 |
538 |
94% |
UK M America |
1930 |
Note that not all FHS Knowles material came to PRM from him, some came via Balfour etc and this is probably explanation of why he collected more stone tools than he donated, the total he donated was 317, not enough to get him into the table above.
Alfred Schwartz Barnes and Arthur John Evans [John Evans collection] donated nearly enough stone tools and weapons to be in the above table.
Here is the league table of stone tool donors:
| Name |
Total number of objects donated * |
Total number of stone tools in donation * |
Total number of stone weapons in donation * |
Total number of stone tools or weapons in donation * |
Total number of all stone tools and weapons * [Total of last 3 columns] |
% of collection that are stone tools & weapons |
Continent most commonly collected in |
Last date by which most objects were donated |
| Estate of Ernest Westlake or Aubrey Westlake |
13,033 |
13,015 |
0 |
0 |
13,015 |
100% |
Australia |
1940 [at latest] |
| Louis Seymour Bazett Leakey |
5,597 |
5,371 |
0 |
224 |
5,595 |
100% |
Africa |
1947 [but most earlier] |
| Henry Balfour |
14,969 |
4,321 |
533 |
244 |
5,098 |
34% |
Mixed |
1938 |
| Augustus Henry Lane Fox Pitt Rivers |
17,927 |
2,681 |
104 |
1,567 |
4,352 |
24% |
Mixed |
1884 |
| Archibald Colquhoun Bell |
3,696 |
3,274 |
63 |
128 |
3,465 |
94% |
Mixed |
1920 |
| Charles Gabriel Seligman & Brenda Seligman |
5,035 |
2,761 |
203 |
487 |
3,451 |
69% |
Mixed |
1940 |
| British School of Archaeology Jerusalem ** |
2,385 |
2,203 |
0 |
31 |
2,234 |
94% |
Asia |
1931 |
| James A. Swan |
1,898 |
1,596 |
4 |
30 |
1,630 |
86% |
Africa |
1954 [but most earlier] |
| Penelope Ward |
1,260 |
1,260 |
0 |
0 |
1,260 |
100% |
Africa |
1935 |
| Anna Tylor [Edward Burnett Tylor] |
2,876 |
1,185 |
62 |
10 |
1,257 |
44% |
Mixed |
1917 |
| William Scoresby Routledge / & Katherine Routledge |
1,349 |
596 |
73 |
252 |
921 |
68% |
Oceania Polynesia and Americas |
1916 |
| Beatrice Blackwood |
6,857 |
451 |
94 |
202 |
747 |
11% |
Mixed |
1975 [but most earlier] |
| Charles Hartley |
659 |
647 |
0 |
0 |
647 |
98% |
Asia |
1920 |
| H.V.V. Noone |
576 |
573 |
0 |
3 |
576 |
100% |
Mixed |
1948 |
| Edward Burnett Tylor |
1,421 |
534 |
26 |
1 |
561 |
39% |
Mixed |
1917 |
| Edward Bagnall Poulton |
570 |
525 |
10 |
3 |
538 |
94% |
UK M America |
1930 |
| Ralph Tanner probably Ralph Esmond Selby Tanner |
1,410 |
508 |
0 |
0 |
508 |
36% |
Africa |
1958 |
We compiled all the field collector and donor tables by assuming that our list of the top 20 field collectors and donors up to 1945 (by size of collection) also probably collected sizeable stone tool collections (and this was shown to be true in most instances), then we looked down both the lists of field collectors and donors to identify those people which had collections over 500 strong to make sure we had not missed some other sizeable collections. In both tables, with the exception of the British School of Archaeology in Jerusalem (and the Egypt Exploration Fund, which had insufficient objects to be included) we excluded all non-individuals and institutions.
ESRC 'Relational Museum'
October 2003