The following tables and graphs are based principally upon the entries in objects prm (the Museum's collections management database) as it was on 24 June 2003 and on a smaller version of that file for objects accessioned up to the end of 1945.
- Table of Contents
- Global statistics
Geographical statistics about the Pitt Rivers Museum s collections up to 1945 (and beyond)
[article ID:428]
Total number of objects -
[article ID:429]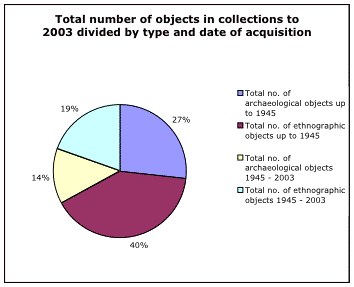
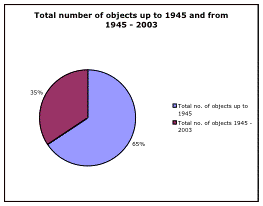

up to 1945 - 179,765 objects
up to 24.6.2003 - 274,624 objects
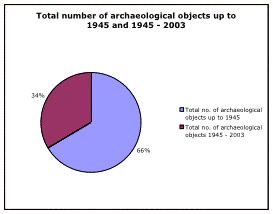
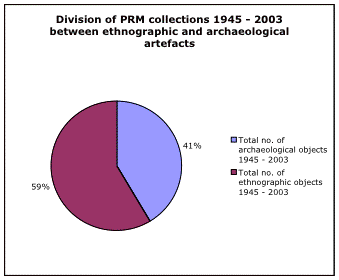
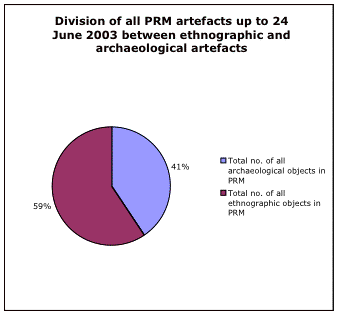
Total number of archaeological objects* -
Up to end 1945 - 79,547 objects
Up to 24.6.2003 - 120,024 objects
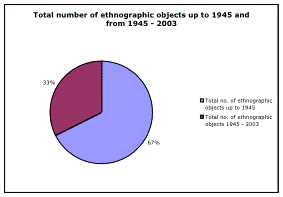
Total number of ethnographic objects * -
up to 1945 - 118,619
up to 24.6.2003 - 175,785 objects
If a steady rate of accession had happened, year on year, throughout the Museum's history, one would have assumed an annual accession rate of approximately 2,288 (274,624 divided by 120 years). In other words, by 1946 one would have expected 139,568 objects to have been collected if roughly the same number of objects were accessioned each year rather than the 179,765 objects that were actually accessioned.
Division of global collections up to 1945 into archaeological and ethnographic objects
[article ID:430]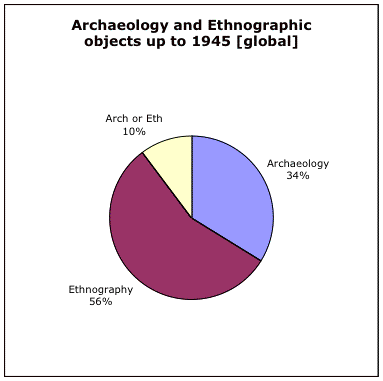
Archaeology objects - 61,145
Ethnography objects - 100,278
Archaeology or Ethnography = 18,342 (that is, items which cannot be classified with certainty as either)
Decades of accessions for global objects:
[article ID:431]
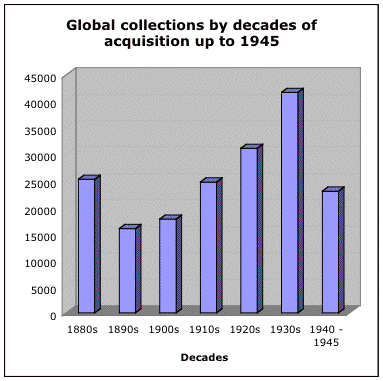
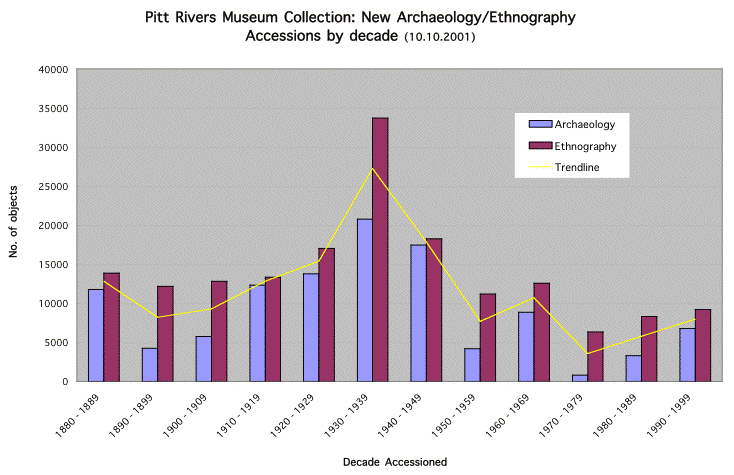
1890s - 15,966 objects
1900s - 17,749 objects
1910s - 24,725 objects
1920s - 31,102 objects
1940 - 1945 - 23,029 objects
The peak in the 1880s is largely due to the founding collection [17,729 objects] and the transfer from the Ashmolean Museum [2,886 objects] and the Oxford University Museum of Natural History [OUMNH] [2,039 objects], other decades have more diverse sources.
Global objects by type of object
[article ID:432]
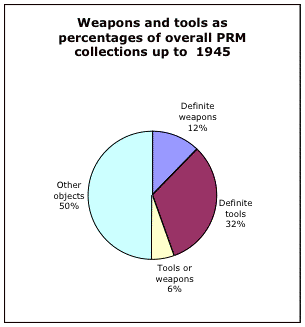
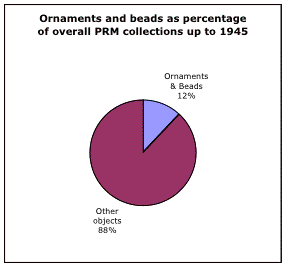
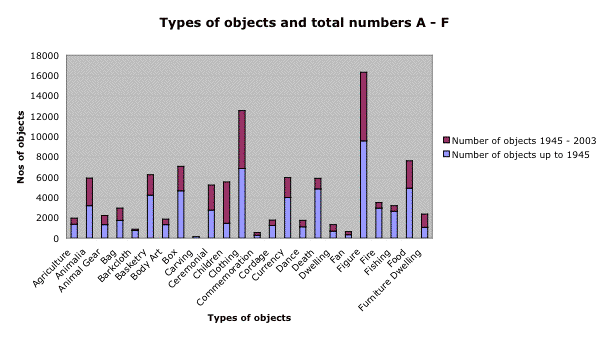
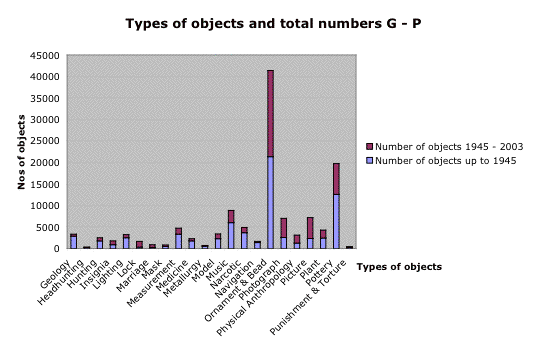
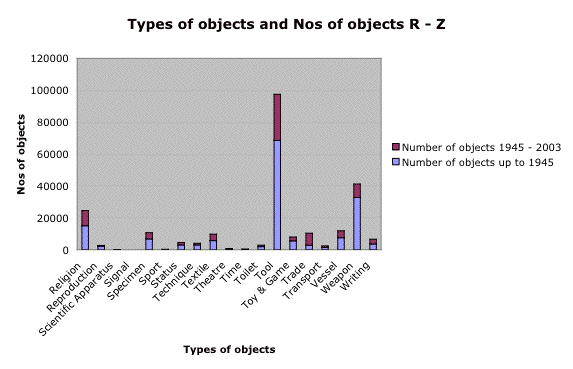
Table to show types of objects collected in descending order of number of objects:
Up to 1945 |
Up to 2003 |
||||
Position |
Type |
No. of objects |
Position |
Type |
No. of objects |
1 |
Tool |
68,459 |
1 |
Tool |
97,442 |
2 |
Weapon |
32,794 |
2 |
Ornament & Bead** |
41,353 |
3 |
Ornament & Bead ** |
21,345 |
3 |
Weapon |
41,056 |
4 |
Religion |
15,125 |
4 |
Religion |
24,477 |
5 |
Pottery |
12,597 |
5 |
Pottery |
19,698 |
6 |
Figure |
9,571 |
6 |
Figure |
16,321 |
7 |
Vessel |
7,463 |
7 |
Clothing |
12,543 |
8 |
Clothing |
6,846 |
8 |
Vessel |
11,941 |
9 |
Specimen |
6,722 |
9 |
Specimen |
10,620 |
10 |
Music |
6,038 |
10 |
Trade |
10,400 |
11 |
Textile |
5,755 |
11 |
Textile |
9,838 |
12 |
Toy & Game |
5,645 |
12 |
Music |
8,879 |
13 |
Food |
4,907 |
13 |
Toy & Game |
7,942 |
14 |
Death |
4,843 |
14 |
Food |
7,616 |
15 |
Box |
4,645 |
15 |
Picture |
7,187 |
16 |
Basketry |
4,235 |
16 |
Box |
7,063 |
17 |
Currency |
3,995 |
17 |
Photograph |
7,020 |
18 |
Narcotic |
3,701 |
18 |
Writing |
6,567 |
19 |
Writing |
3,670 |
19 |
Basketry |
6,247 |
20 |
Measurement |
3,325 |
20 |
Currency |
5,960 |
21 |
Animalia |
3,181 |
21 |
Animalia |
5,899 |
22 |
Technique |
2,990 |
22 |
Death |
5,872 |
23 |
Fire |
2,946 |
23 |
Children |
5,536 |
24 |
Status |
2,941 |
24 |
Ceremonial |
5,210 |
25 |
Geology |
2,910 |
25 |
Narcotic |
4,905 |
26 |
Trade |
2,800 |
26 |
Measurement |
4,757 |
27 |
Ceremonial |
2,761 |
27 |
Status |
4,561 |
28 |
Fishing |
2,654 |
28 |
Plant |
4,323 |
29 |
Photograph |
2,552 |
29 |
Technique |
4,069 |
30 |
Lighting |
2,516 |
30 |
Fire |
3,507 |
31 |
Plant |
2,433 |
31 |
Model |
3,412 |
32 |
Picture |
2,369 |
32 |
Geology |
3,330 |
33 |
Model |
2,306 |
33 |
Lighting |
3,257 |
34 |
Reproduction |
2,274 |
34 |
Fishing |
3,181 |
35 |
Toilet |
2,017 |
35 |
Physical Anthrop |
3,153 |
36 |
Hunting |
1,786 |
36 |
Bag |
2,951 |
37 |
Medicine |
1,774 |
37 |
Toilet |
2,891 |
38 |
Bag |
1,744 |
38 |
Reproduction |
2,757 |
39 |
Transport |
1,563 |
39 |
Hunting |
2,520 |
40 |
Children |
1,473 |
40 |
Furniture Dwelling |
2,372 |
41 |
Navigation |
1,397 |
41 |
Transport |
2,352 |
42 |
Agriculture |
1,374 |
42 |
Medicine |
2,269 |
43 |
Animal Gear |
1,326 |
43 |
Animal Gear |
2,223 |
44 |
Body Art |
1,321 |
44 |
Agriculture |
1,957 |
45 |
Physical Anthrop |
1,303 |
45 |
Body Art |
1,869 |
46 |
Cordage |
1,244 |
46 |
Insignia |
1,793 |
47 |
Dance |
1,120 |
47 |
Cordage |
1,780 |
48 |
Furniture Dwelling |
1,061 |
48 |
Dance |
1,737 |
49 |
Insignia |
894 |
49 |
Navigation |
1,661 |
50 |
Barkcloth |
762 |
50 |
Lock |
1,649 |
51 |
Dwelling |
681 |
51 |
Dwelling |
1,322 |
52 |
Metallurgy |
548 |
52 |
Marriage |
884 |
53 |
Mask |
525 |
53 |
Barkcloth |
866 |
54 |
Theatre |
390 |
54 |
Mask |
863 |
55 |
Lock |
357 |
55 |
Metallurgy |
725 |
56 |
Fan |
334 |
56 |
Theatre |
693 |
57 |
Marriage |
293 |
57 |
Fan |
626 |
58 |
Headhunting |
290 |
58 |
Commemoration |
537 |
59 |
Commemoration |
285 |
59 |
Punishment & Torture |
449 |
60 |
Punishment & Torture |
253 |
60 |
Headhunting |
329 |
61 |
Sport |
238 |
61 |
Sport |
289 |
62 |
Time |
193 |
62 |
Time |
264 |
63 |
Carving |
134 |
63 |
Carving |
153 |
64 |
Signal |
43 |
64 |
Scientific Apparatus |
103 |
65 |
Scientific Apparatus |
27 |
65 |
Signal |
64 |
Commentary on table:
This information was compiled by calling up each category or type of object in the relevant database (objects prm [PRM collections management artefact database as on 24 June 2003] and the objects up to 1945 database created to compile all the statistics for the Relational Museum project) and then totaling the number of objects in each case. It is therefore counting all objects in this category. Note that any one object might be catalogued (and therefore appear in) more than one typology. A fishing spear for example would appear both under fishing and weapon.
Sadly (because it would have been nice to have a really striking difference which showed a dramatic shift in collecting policy or practise) the top 5 objects remain the same between 1945 and 2003 with tools (specifically stone tools) being, by a large margin in both cases, the object which has been collected the most. It is probable that the fact that the second category (for 1945), weapons, is so common also relates principally to large numbers of stone artefacts.
We would guess that most people who know about the collections and the Museum displays would expect ornaments to be a large proportion of the overall collections and as expected, they come in at either position 3 in 1945 or one higher (position 2) in 2003. The relative swap of positions between 1945 and 2003 of weapons and ornaments does not seem particularly significant to us given that the 2003 difference in numbers is so small [297 objects]. However significantly more ornaments than weapons were collected between 1945 and 2003 because the difference in totals in 1945 between the two types of objects was much greater (11,449), and this is probably significant. The reason for this shift is unknown.
Proportional decrease in numbers from 1945 to 2003
Musical instruments have become slightly less numerous proportionally than they were in 1945 (down from position 10 to position 12) and this might reflect Balfour's interest in musical instruments which was probably not replicated in the Museum after his death until Helene La Rue came into post. Although the positions have changed though there is still a significant amount of musical accessions and it was therefore still being actively collected.
More significant decreases proportionally from 1945 to 2003 are for objects related to Death (down from position 14 to 22), Narcotics (down from 18 to 25), Measurement (down from 20 to 26), Technique (from 22 to 29), Fire related items (from 23 to 30), Geology (25 to 32), Fishing (28 to 34), and Navigation (41 to 49). These decreases might simply relate to changes in academic / anthropological fashion or to chance.
Proportional increases from 1945 to 2003
Trade is one of the most significant increases (discussed below, from 26 to 10), Photography (proportional increase from position 29 to 17), Pictures (from 32 to 15), items associated with Children (from 40 to 23), Physical Anthropology (from 45 to 35), and Furniture Dwelling (from 48 to 40).
Items that are associated with trade rapidly increase between 1945 and 2003, from 2,800 objects to 10,400 (and from position 26 to position 10). It is probable that this relates to the fact that when cataloguing 'tourist items' they are catalogued using 'trade' as a class, and that there is a far greater percentage of items perceived as being tourist related between 1945 and 2003 than there was before (or perhaps, merely that there is an increase in the number of items identified as such).
Photography is interesting as from circa 1980 (Elizabeth Edwards joined the museum in 1977) photographic new accessions were not catalogued as part of the object collections (they were catalogued separately), one might therefore assume that the number of photographs accessioned as part of the object catalogues would decrease after 1945 but this is not so, we do not know the reason for this. It is unclear why the number of pictures should have increased disproportionally. Elizabeth Edwards suggested that this might be due to the fact that single collections of photographers were much larger post 1945 than they tended to be prior to 1945 and that this might explain the increase. She also explained that the accessioning of photographs was always very ad hoc and uncertain. There are photograph collections in the museum which came in very early but were not included in the accession books (for example, Damman) whereas other collections were. She suggested that it might be that collections which were purchased might have been handled separately from those which were considered part of teaching resources (like lecture notes) and this might have meant different accessioning procedures. Until she came accessioning of photographs was never handled in what would be considered now to be an appropriate way.
Physical anthropology is an interesting increase but one would have expected a significant decrease in proportion as general anthropological interest in such matters declined. We therefore decided to investigate this further. By finding out the exact specimens which had been acquired from 1945 to 2003 (not an easy matter) and reviewing each one we found that roughly half of the accessions post 1945 were items that had been found unentered and therefore could have been collected prior to 1945 in some or all instances. However the other half of the entries were new accessions of human remains (in some instances made into objects such as amulets).
Breakdown of global statistics between continents:
[article ID:433]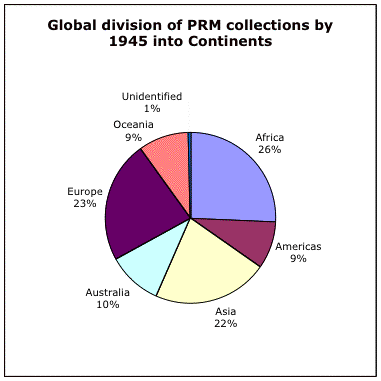
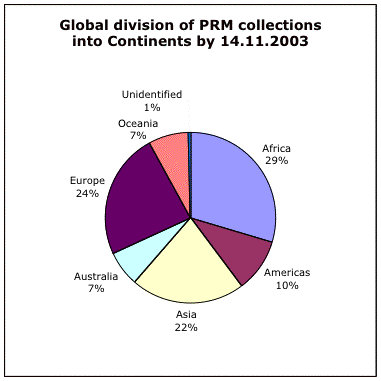
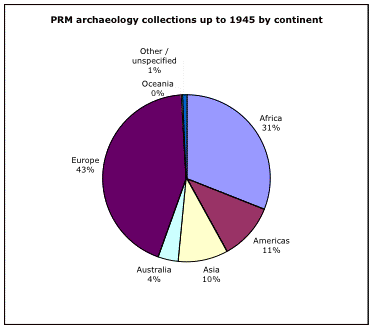
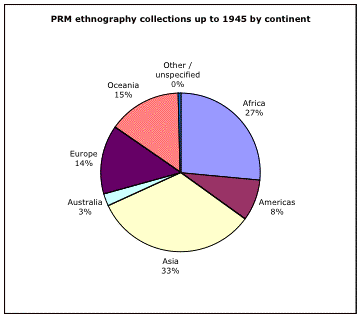
Africa - 47,114
Americas: 15,715
Asia (including SE Asia) - 40,232
Australia - 18,465
Europe - 41,898
Oceania - 17,088
Unknown - 1,091
[Note that there is a certain amount of double-counting between continents]
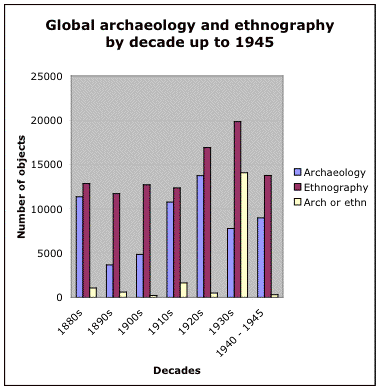
Dividing the global collections by decade and continent:
Continents / Decades |
Archaeology |
Ethnography |
Archaeology or Ethnography |
Totals[1] |
Global |
||||
1880s |
11,339 |
12,836 |
1,059 |
25,234 |
1890s |
3,653 |
11,714 |
599 |
15,966 |
1900s |
4,844 |
12,696 |
209 |
17,749 |
1910s |
10,747 |
12,347 |
1,631 |
24,725 |
1920s |
13,722 |
16,903 |
477 |
31,102 |
1930s |
7,785 |
19,839 |
14,047 |
41,671 |
1940 - 1945 |
8,976 |
13,757 |
296 |
23,029 |
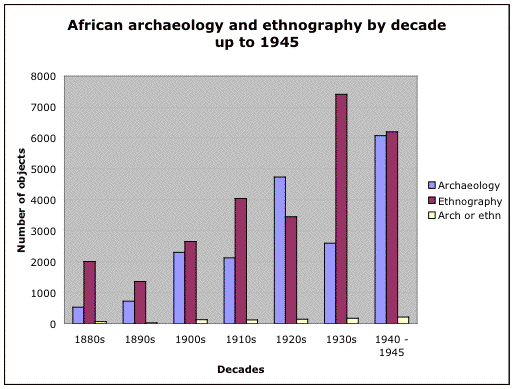
Africa |
||||
1880s |
531 |
2,004 |
65 |
2,600 |
1890s |
726 |
1,365 |
27 |
2,118 |
1900s |
2,306 |
2,654 |
122 |
5,082 |
1910s |
2,128 |
4,043 |
119 |
6,290 |
1920s |
4,733 |
3,453 |
143 |
8,329 |
1930s |
2,602 |
7,410 |
168 |
10,180 |
1940 - 1945 |
6,069 |
6,194 |
212 |
12,475 |
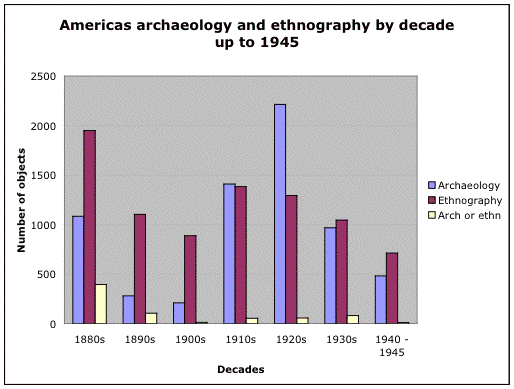
Americas |
||||
1880s |
1,083 |
1,949 |
393 |
3,425 |
1890s |
280 |
1,104 |
105 |
1,489 |
1900s |
209 |
887 |
13 |
1,109 |
1910s |
1,409 |
1382 |
53 |
2,844 |
1920s |
2,214 |
1,292 |
57 |
3,563 |
1930s |
966 |
1,045 |
79 |
2,090 |
1940 - 1945 |
480 |
713 |
9 |
1,202 |
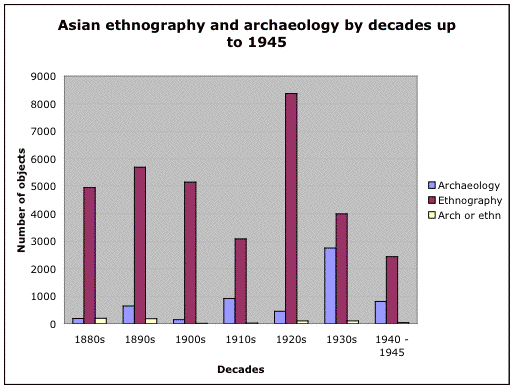
Asia |
||||
1880s |
186 |
4,942 |
194 |
5,322 |
1890s |
639 |
5,684 |
176 |
6,499 |
1900s |
143 |
5,139 |
12 |
5,294 |
1910s |
908 |
3,075 |
20 |
4,003 |
1920s |
443 |
8,359 |
93 |
8,895 |
1930s |
2746 |
3,987 |
95 |
6,828 |
1940 - 1945 |
802 |
2,430 |
34 |
3,266 |
Australia |
||||
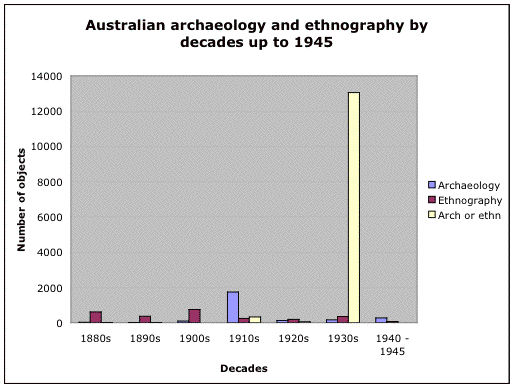
1880s |
24 |
608 |
20 |
652 |
1890s |
9 |
361 |
13 |
383 |
1900s |
94 |
744 |
2 |
840 |
1910s |
1,735 |
242 |
333 |
2,310 |
1920s |
117 |
189 |
58 |
364 |
1930s |
165 |
349 |
13,053 |
13,567 |
1940 - 1945 |
269 |
74 |
4 |
347 |
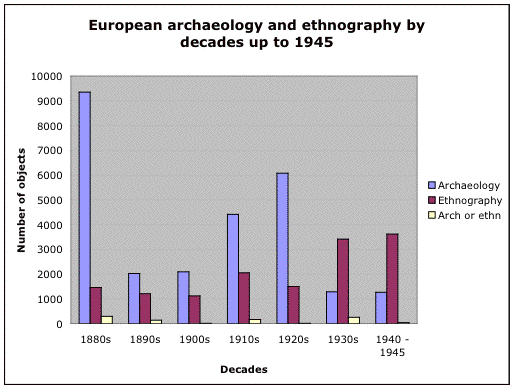
Europe |
||||
1880s |
9,346 |
1,462 |
292 |
11,100 |
1890s |
2,018 |
1,209 |
138 |
3,365 |
1900s |
2,088 |
1,121 |
10 |
3,219 |
1910s |
4,409 |
2,051 |
164 |
6,624 |
1920s |
6,078 |
1,495 |
12 |
7,285 |
1930s |
1,283 |
3,415 |
248 |
4,946 |
1940 - 1945 |
1,259 |
3,620 |
36 |
4,915 |
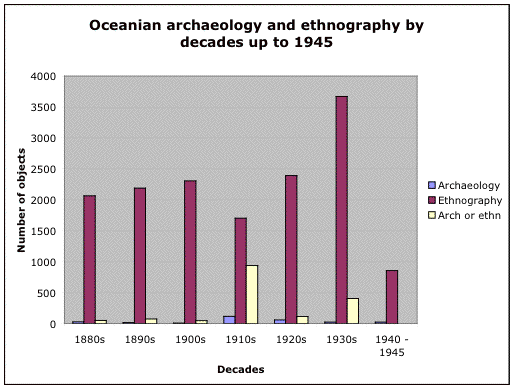
Oceania |
||||
1880s |
26 |
2,066 |
52 |
2,144 |
1890s |
14 |
2,190 |
75 |
2,279 |
1900s |
9 |
2,307 |
46 |
2,362 |
1910s |
118 |
1,701 |
937 |
2,756 |
1920s |
59 |
2,389 |
113 |
2,561 |
1930s |
24 |
3,671 |
404 |
4,099 |
1940 - 1945 |
22 |
854 |
1 |
877 |
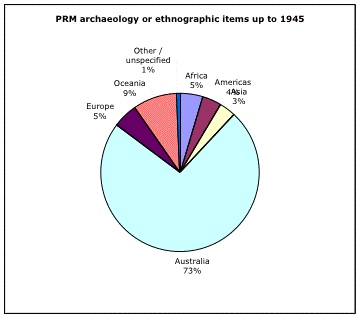
Continents |
Archaeology |
Ethnography |
Archaeology or Ethnography |
Totals |
Global |
61,145 |
100,278 |
18,342 |
179,765 |
Africa |
19,078 |
27,178 |
858 |
47,114 |
Americas |
6,640 |
8,365 |
710 |
15,715 |
Asia |
5,871 |
33,736 |
624 |
40,231 |
Australia |
2,413 |
2,569 |
13,483 |
18,465 |
Europe |
26,575 |
14,394 |
929 |
41,898 |
Oceania |
272 |
15,188 |
1,628 |
17,088 |
'Relational Museum' project team
October 2003
[1] Note that there are around 400 entries which do not have a decade date as they were either removed from the museum post acquisition but before accession numbers were assigned or for a variety of other reasons, this means that you do NOT get the total number of objects for the continent if you add up each decade (or globally). For similar reasons adding up all the archaeological totals will not give you the overall archaeological figures given in the section on archaeological and ethnographic statistics (because there are entries which do not have specified continent etc).
